
Marketing AI agent measurement has a problem that no adoption chart will show you. More than half of marketing organizations now use AI agents, and the most common job those agents do is reporting and analytics. Read that again slowly. The tool that does the work also writes the report on how the work went.
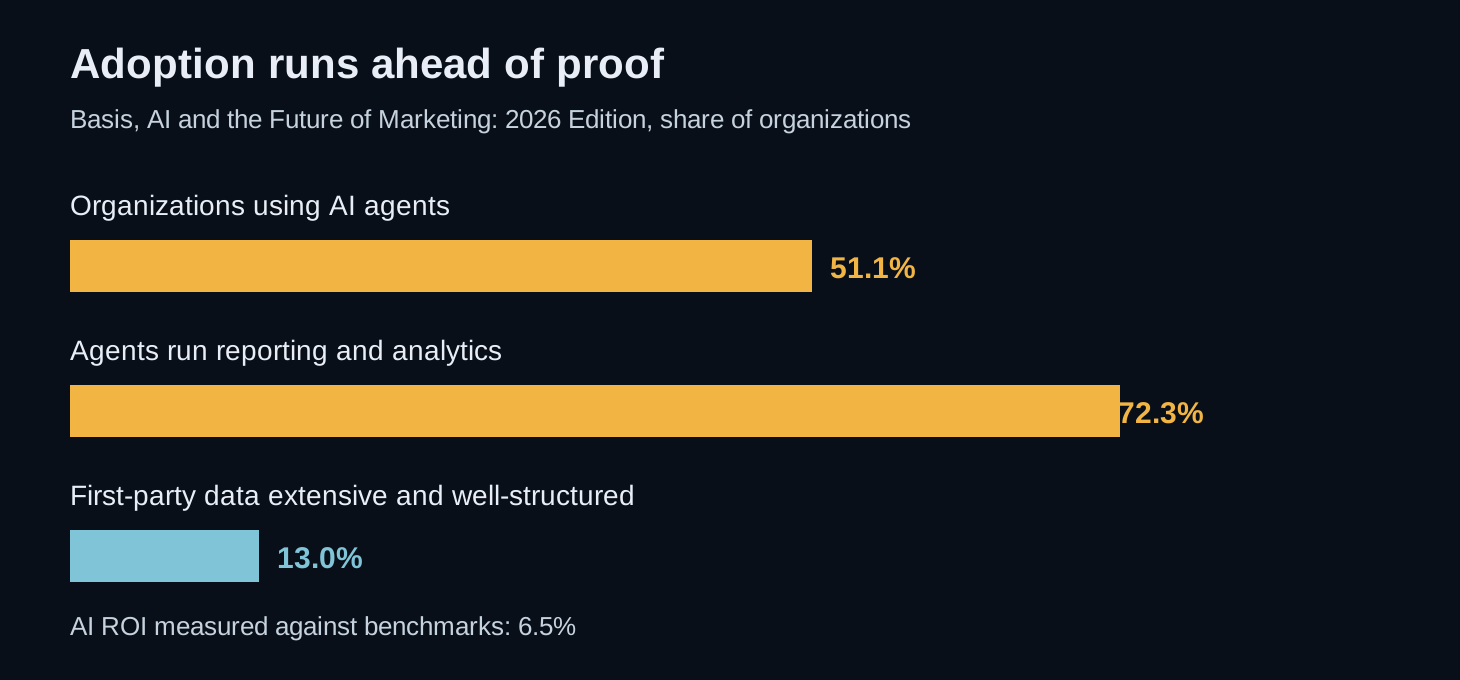
Basis surveyed 184 marketing and advertising professionals in August 2026 for its AI and the Future of Marketing: 2026 Edition. The headline numbers look like a victory lap. AI agent use jumped 155.5 percent in a year, with 51.1 percent of organizations now deploying agents. Daily use of generative or agentic AI nearly doubled, from 33.6 percent to 61.4 percent. Almost everyone, 98.4 percent, uses it in some form.
Then the survey asks the question that matters, and the victory lap stops. Only 6.5 percent of organizations measure the return on their AI investments against defined benchmarks. Another 65.1 percent either do not measure it at all or do not know whether anyone in their organization does. Agents run reporting and analytics at 72.3 percent of agent-using organizations, and draft campaign briefs at 56.4 percent. So the reports keep coming, the briefs keep flowing, and almost nobody has a fixed number to check any of it against.
That is not an adoption story. It is a grading story. And the student is holding the red pen.
The Report Card Problem
Picture a normal marketing review. A team runs a campaign, counts what happened, and decides whether to spend more. The counting is the boring part, and it is also the part that keeps everyone honest. Now hand the counting to the same system that ran the campaign. It picks the metrics, pulls the data, writes the summary, and recommends the next spend. Your team reads a confident report and scales the thing the report just praised.
Nothing in that loop is a lie. That is what makes it dangerous. An agent report can be accurate about the numbers it chose and still be useless as a judgment, because it never had to answer the question a skeptic would ask. Did this beat the old way of doing it. Did it beat doing nothing. Would a human counting from the raw source get the same number.
Basis found 47.8 percent of organizations replaced human tasks with AI solutions in the past 12 months, up from 27.9 percent a year earlier. Replacing a task is not the same as proving the replacement worked. When the replaced task is reporting itself, the proof disappears with the person who used to do it. The organization keeps the output and loses the check.
Campaign briefs make the loop tighter. An agent that drafts the brief sets the goals, the audience, and the success metric. A second pass by the same kind of system then reports against those goals. Success was defined by the system, measured by the system, and declared by the system. A human signed off somewhere in the middle, usually on a summary, not on the source data. That signature feels like oversight. It is closer to applause.
The Input Nobody Trusts
There is a second crack in the loop, on the input side. Basis asked marketers about their first-party data, the customer records their agents read to do all this work. Only 13.0 percent described that data as extensive and well-structured, down from 17.9 percent a year earlier. Agents are reading records that most of the marketers surveyed will not call well-structured.
Think about what an agent does with messy input. It does not stop and complain. It fills gaps, picks the most likely record, merges duplicates the way its instructions tell it to, and moves on. A human analyst working from the same mess would at least notice the mess. The agent treats the mess as an instruction and produces a clean-looking answer from it. Clean output from dirty input is the oldest trap in analytics, and agents spring it faster than people ever could.
Nielsen's eighth Annual Marketing Report, published October 27, 2026, adds a matching number from the other side of the industry. Nearly 68 percent of marketers use AI for measurement and analytics, yet only 15 percent can connect their AI-discovery spend to return on investment. Measurement is automated. Proof is not. The gap between those two numbers is where budgets quietly leak.
Here is the shape of the whole problem in one picture. Agents take in data few teams trust, do work few teams benchmark, and report results few teams verify. Every step of that chain got faster this year. None of it got more checkable. Speed without a check is not efficiency. It is just a faster way to be wrong with confidence.
The Only Skeptic Left
Nielsen's report contains the detail that reframes the whole story. Consumers are doing the verification that marketers stopped doing. About 52 percent of US consumers use AI for content discovery at least once a month, and 75 percent of people verify the results AI gives them because they do not trust them.
Your customer checks the machine. Your team does not. That is backwards, and it will not stay harmless for long. A customer who verifies an AI answer and finds it wrong blames the brand behind the answer. A team that never verifies an agent report will keep scaling the answer until a customer, a finance reviewer, or a regulator does the checking for them. Verification delayed is not verification avoided. It just arrives from someone with less patience.
Borrow the customer's habit. Skepticism is not anti-AI. It is the price of using a system that sounds sure of itself whether it is right or wrong. The teams that survive the agent era will not be the ones that used agents first. They will be the ones that kept one independent way of knowing whether the agents worked.
The Two-Way Check
Most advice about agent oversight misses half the loop. It tells you to review the output before it ships, which is worth doing, and stops there. A report that was generated from bad input and graded by its own author needs checking on both sides. Check what went in. Check what came out. And make at least one of those checks independent of the agent entirely, so the system cannot grade its own homework twice.
The loop looks like this. An agent reads customer and campaign data, acts on it, and reports the result. The team reads the report and scales the action. Each turn around the loop feels like progress, because something shipped and something was measured. But if the input was never checked and the report was never checked against a source the agent did not touch, the loop is a circle, not a climb. It returns to the same confidence it started with, slightly higher each time.
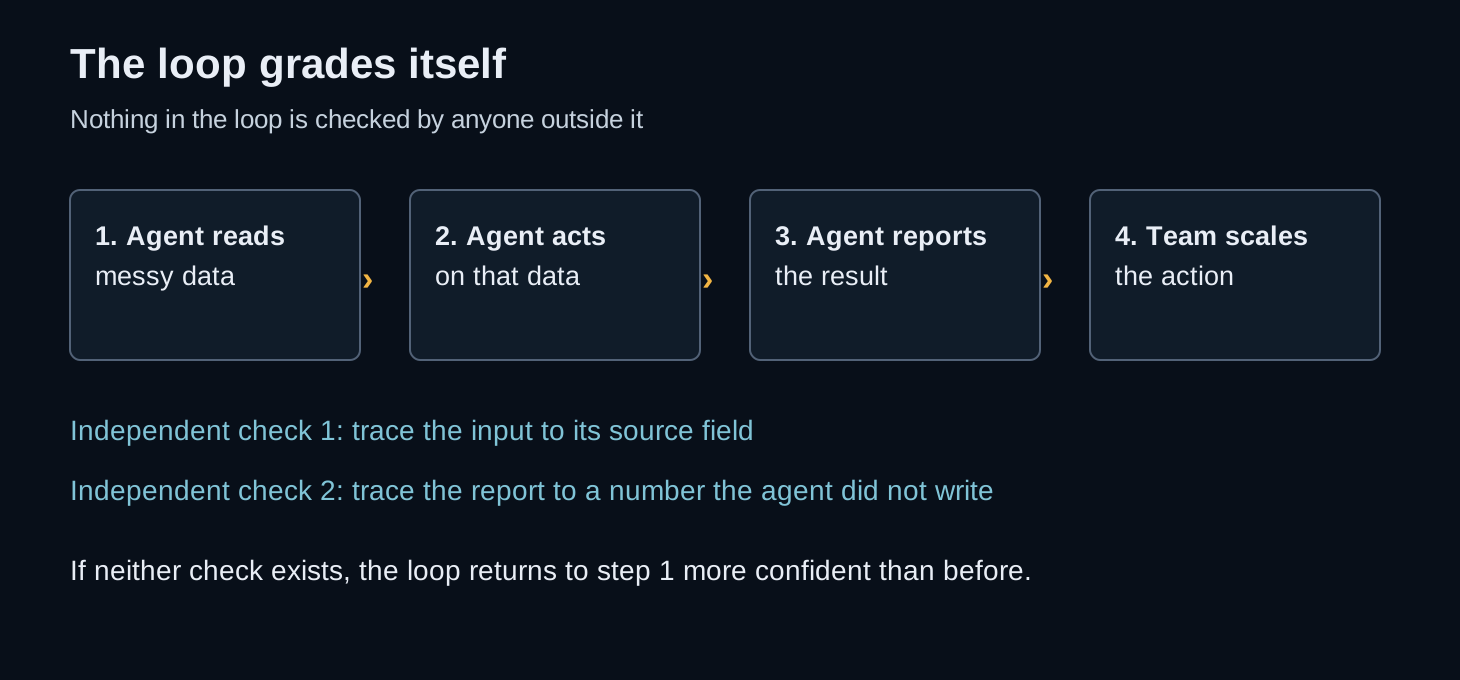
An independent check is not a second agent watching the first one. A second agent reads the same messy data, shares the same blind spots, and writes its report in the same confident tone. Independence means a different source, a different method, or a different person. A human counting from raw records counts as independent. A finance system that already tracks revenue counts as independent. A holdout group that never touched the agent counts as independent. Another prompt does not.
Four Moves That Break the Loop
Start with one human-owned number per campaign. Pick it before the agent starts, write it down where the agent cannot edit it, and make it the number that decides scale. It can be revenue from the finance system, signups counted from the product database, or cost per acquired customer from the ad platform invoice. The point is not that the number is perfect. The point is that the agent did not produce it. When the agent report and the human-owned number disagree, the human-owned number wins until someone explains the gap from the raw source.
Next, freeze the fields the agent reads. For each agent task, list the exact fields it may use, and name the system that owns each field. Price comes from the product catalog, not from a landing page draft. Customer status comes from the CRM, not from a spreadsheet someone edited last quarter. When a field changes, the change goes through the owner, not through the agent's memory of what the field used to say. This is unglamorous work. It is also the only thing standing between your agent and a confident answer built on stale facts.
Then sample against the raw source every week. Take a small slice of agent output, five reports or ten decisions, and trace each one back to the source records by hand. Not a dashboard review, a trace. Does the customer exist. Does the number match. Did the agent use the field it was supposed to use. Write down what you find, including the misses. A weekly sample that finds nothing for a month is good news you earned. A weekly sample you skip for a month is how a quiet error becomes a quarterly number.
The report looks finished. That is the problem. A finished-looking report asks to be believed, and belief is cheaper than a trace back to the source.

Finally, cap scale until the check passes. Tie budget increases to the human-owned number, not to the agent report. If the agent wants twice the spend, the independent number has to move first. This rule sounds harsh until you compare it with the alternative, which is what most teams do now. They scale on the report, discover the gap in a quarterly review, and explain it as a learning. A cap turns the learning into a gate. The agent earns more room by being right in a way someone else can confirm.
One traced report beats ten confident ones. Pick a slice, follow it to the source, and write down what you find.

What Not to Do
Do not buy a monitoring agent to watch your working agent and call that oversight. You have added a second student to grade the first student's homework, and both of them will sound sure. Do not count agent-written reports as measurement in your board deck, even with a footnote. A footnote does not make a self-graded report independent. Do not fix this with a new dashboard that visualizes agent output more beautifully. A prettier loop is still a loop.
And do not wait for a vendor benchmark to save you. Basis itself notes that only 6.5 percent of organizations measure against defined benchmarks, which means the industry has not agreed on what good looks like yet. Your benchmark does not need to be an industry standard. It needs to be yours, written down before the work starts, and owned by someone who does not benefit from the agent looking good.
The Metric That Matters Now
Watch the gap, not the adoption. Adoption will keep climbing. Agent use at 51.1 percent will look quaint in a year. The number that tells you whether your team is in control is the share of agent-driven decisions backed by an independent check. Count it honestly. If ten agent reports went out this month and two were traced to the raw source, your checked share is two in ten, and you know exactly how much room you have to improve.
I have written before about the invisible costs when agents fail and about how agent measurement collapses when nobody owns the number. This is the mechanism underneath both of those stories. Failures stay invisible when the failure report is written by the thing that failed. Measurement collapses when the number everyone quotes comes from the system being measured.
The agent era does not need fewer agents. It needs one check the agent cannot write, one number the agent cannot touch, and one person willing to read the source before signing the scale-up. Let the agent do the work. Keep the grade for yourself.